All your portfolio data in one place — real-time performance, clean dashboards, and detailed tracking.
Get Early Access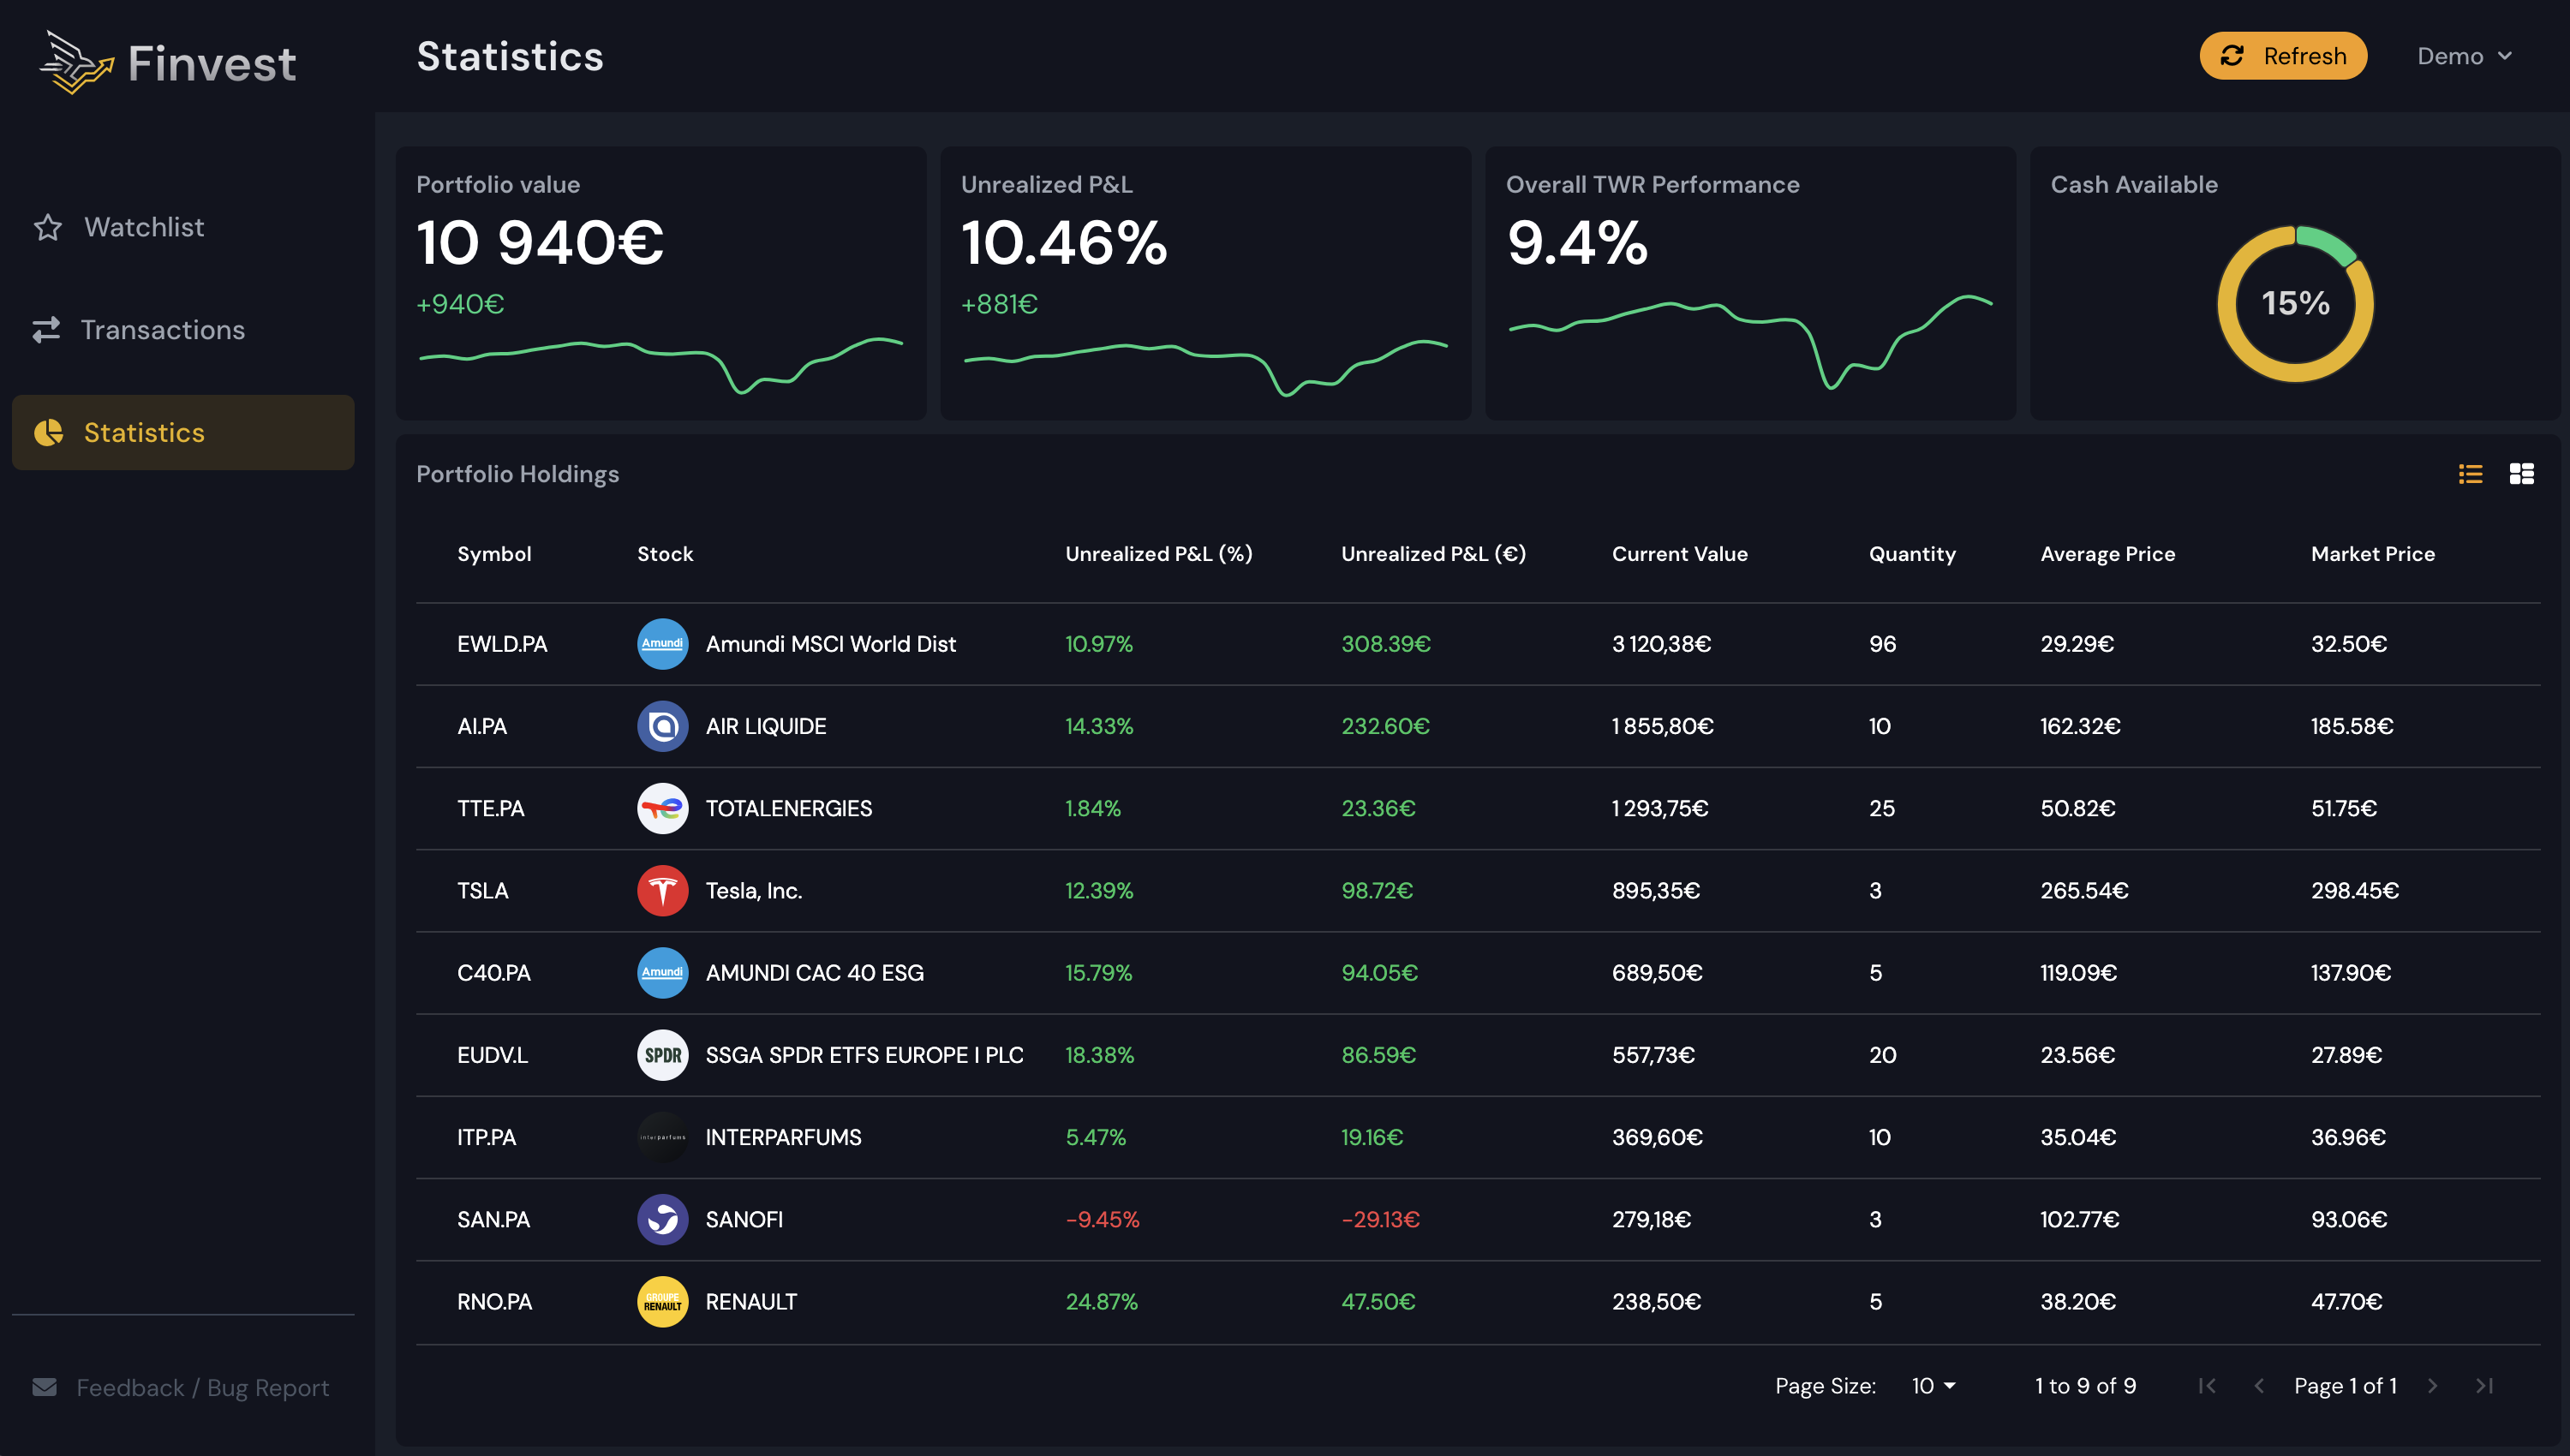
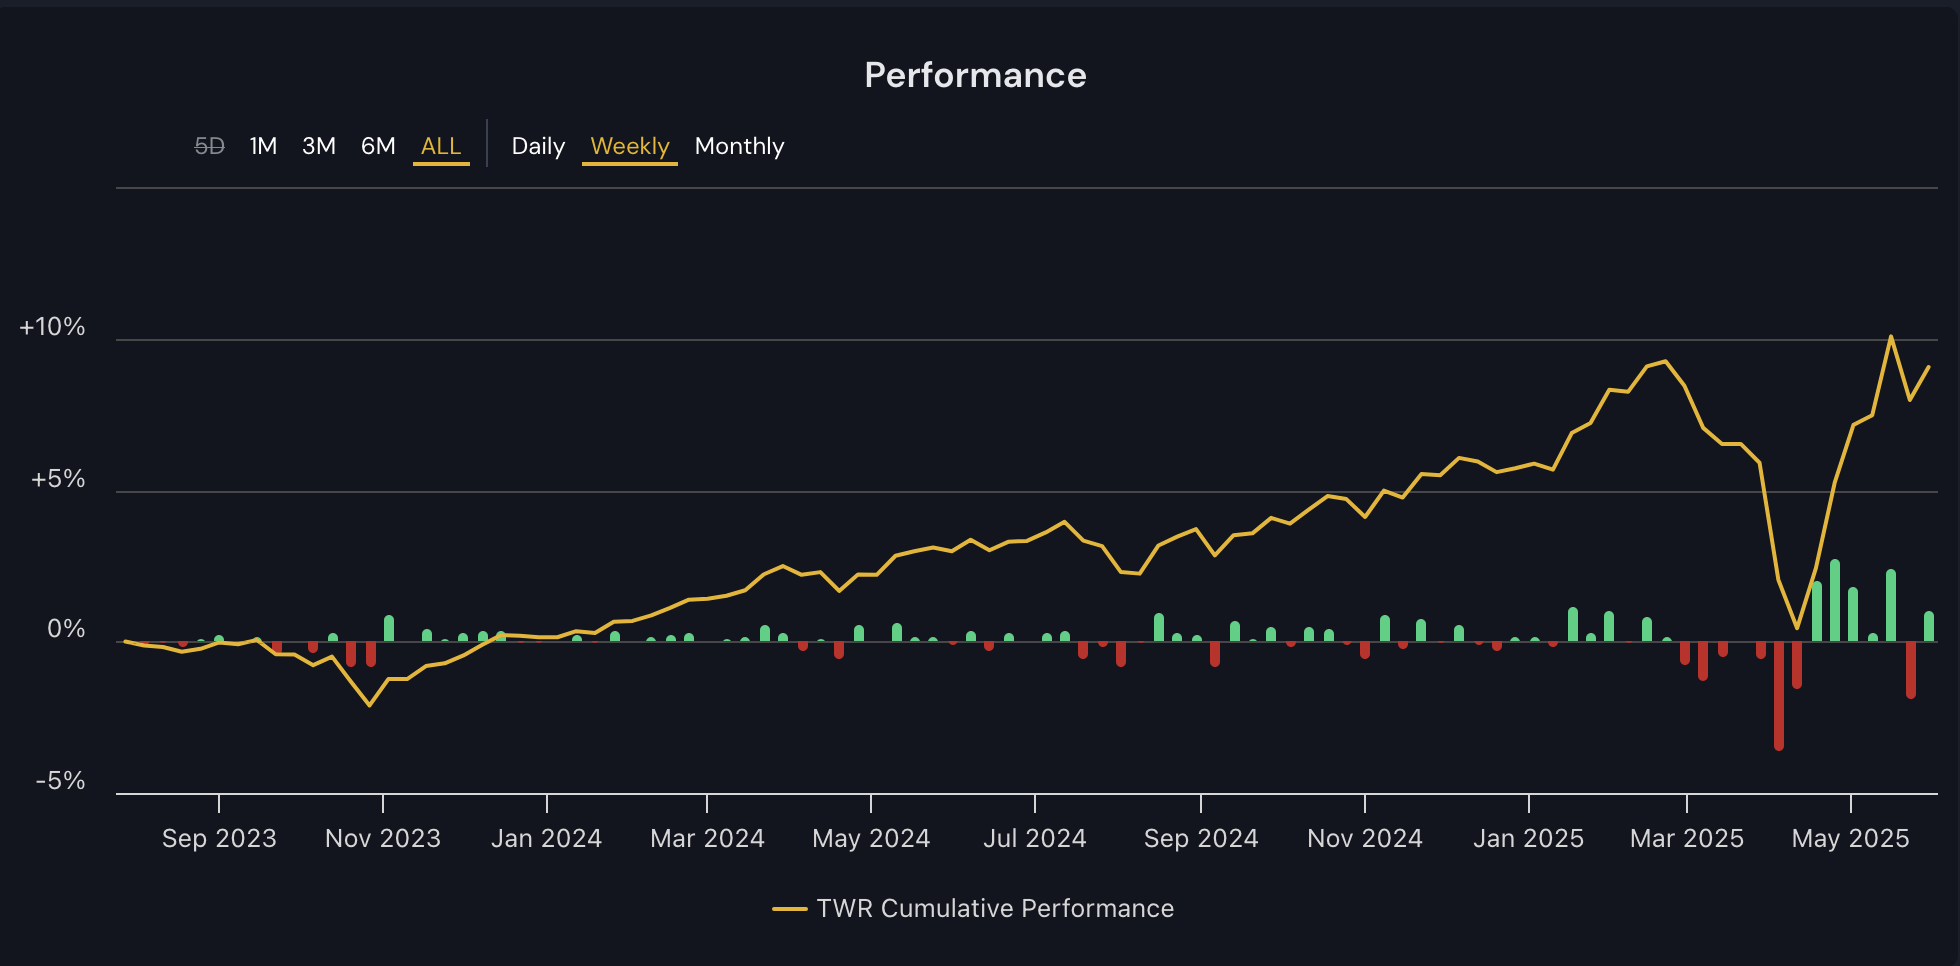
Track your portfolio's performance in real time with Time-Weighted Return (TWR).
TWR is the reference for measuring investment results: it neutralizes the impact of deposits and withdrawals, allowing you to compare your performance fairly with benchmarks and other investors. Instantly see your gains and losses, and get a clear, unbiased view of your progress.
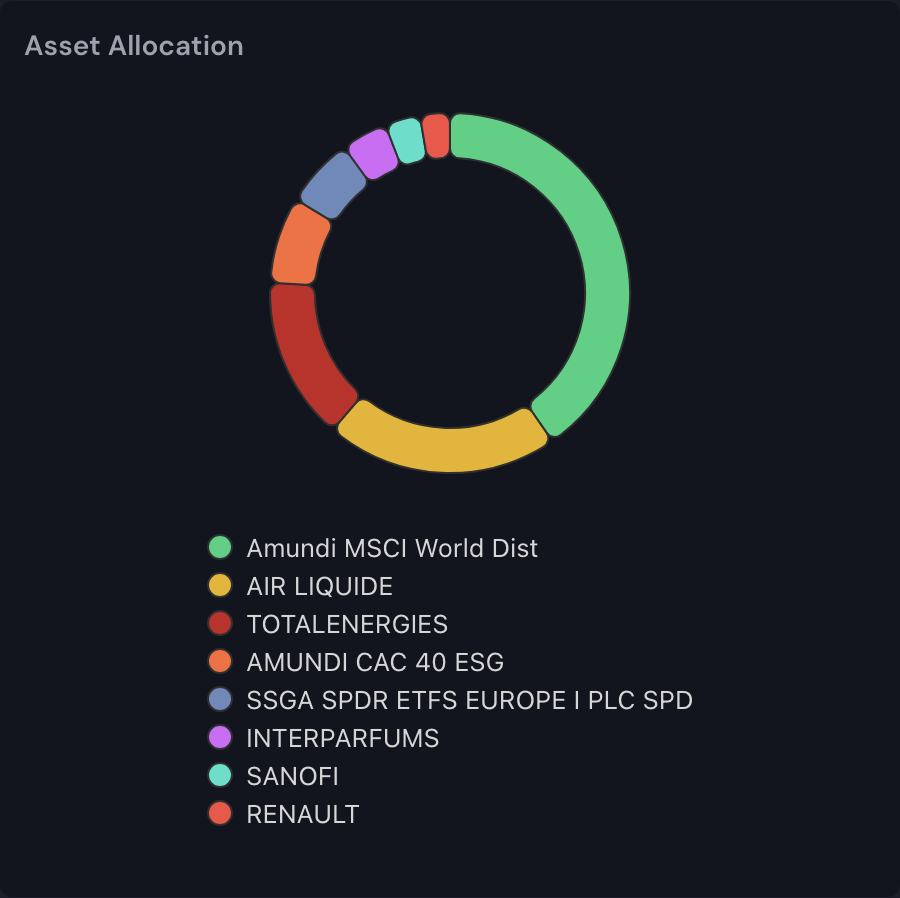
Breakdown of your assets by investment class.
Visualize how your investments are distributed across stocks, bonds, cash, and other asset classes. This widget helps you maintain a balanced portfolio and manage risk efficiently.
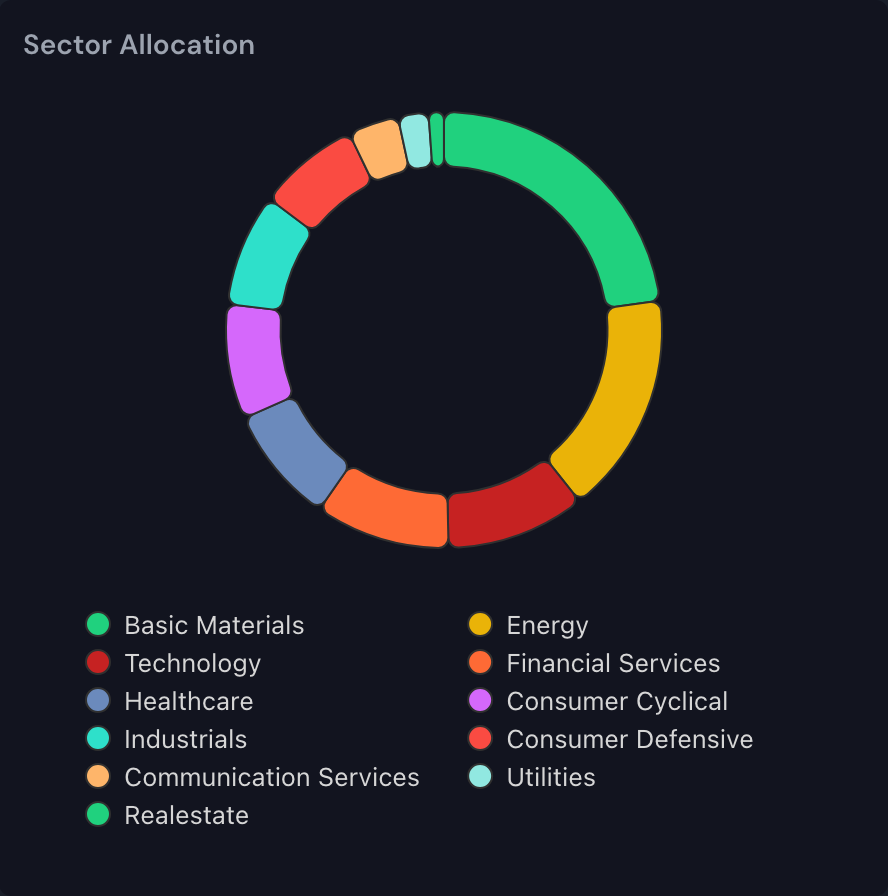
Sector analysis of your portfolio for better diversification.
See which sectors (tech, healthcare, finance, etc.) dominate your portfolio. Identify overexposure and discover diversification opportunities to reduce risk and capture growth.
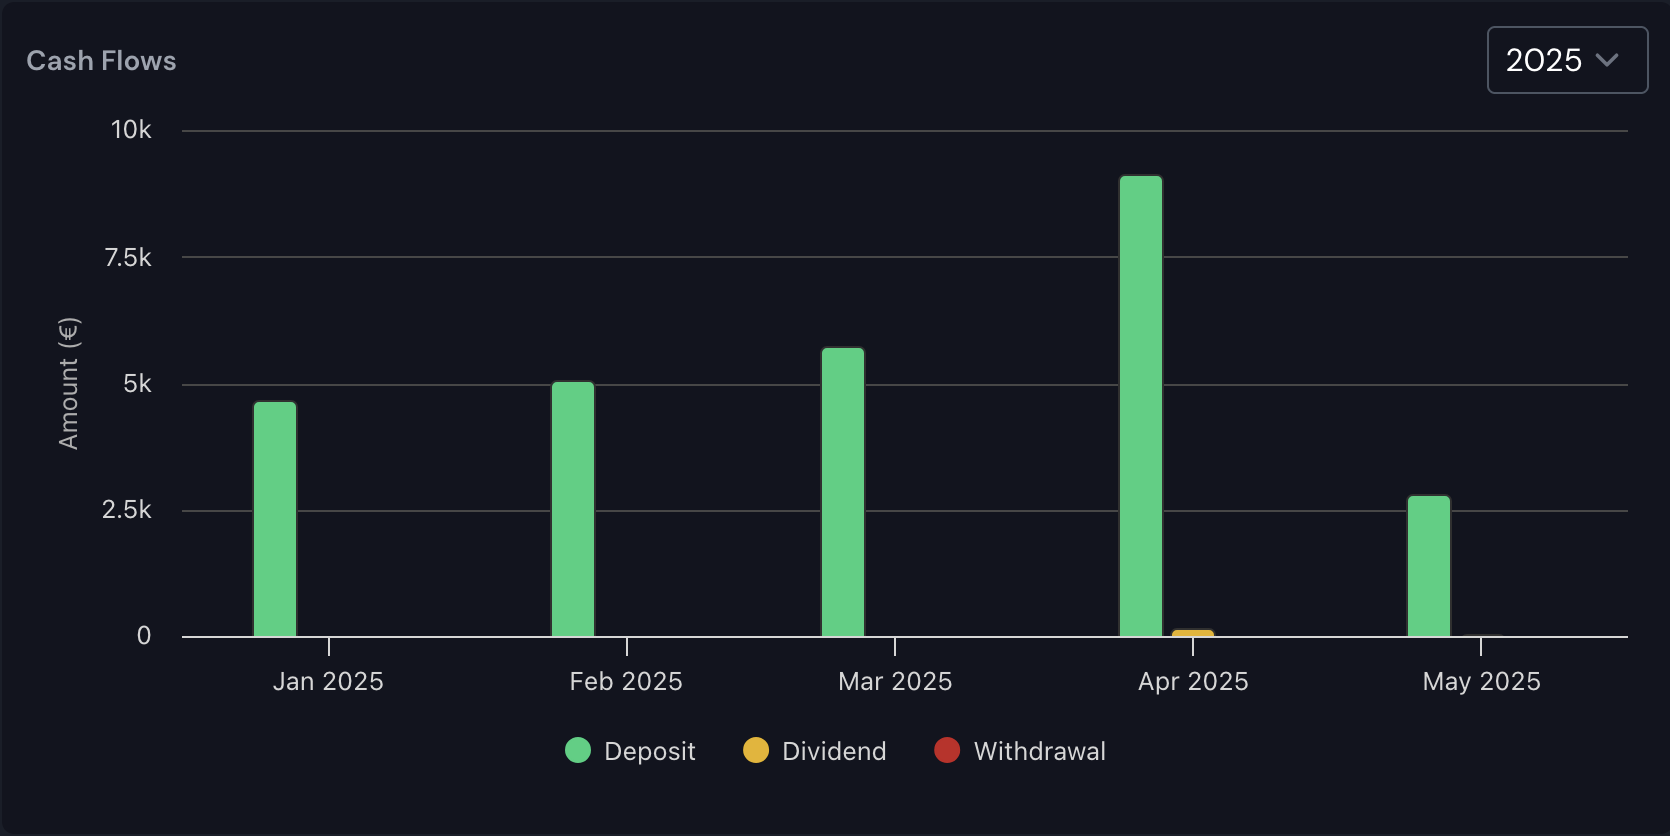
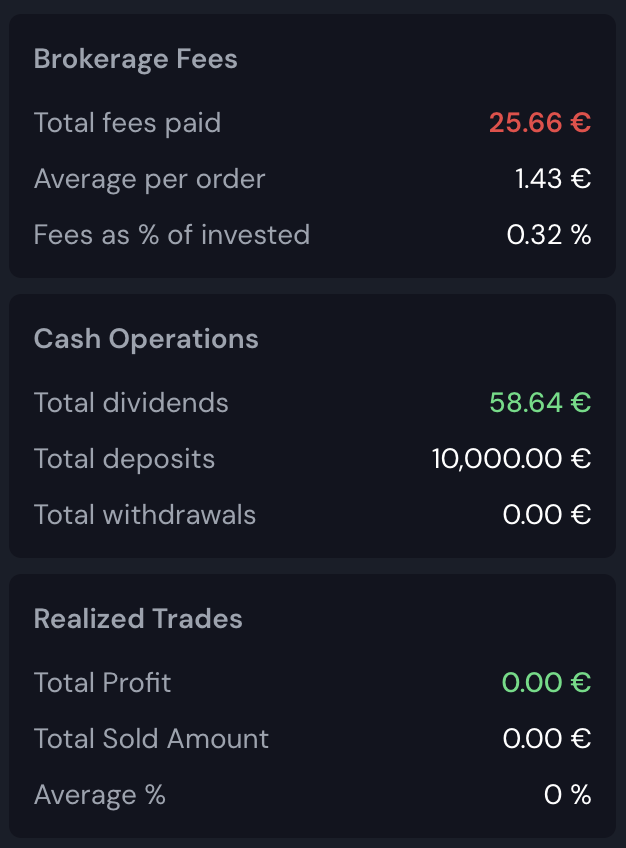
Visualize all your deposits, withdrawals, and dividends.
Track every movement of money in and out of your portfolio. The cash flows widget gives you a clear picture of your net contributions and income, making it easy to analyze your investment strategy.
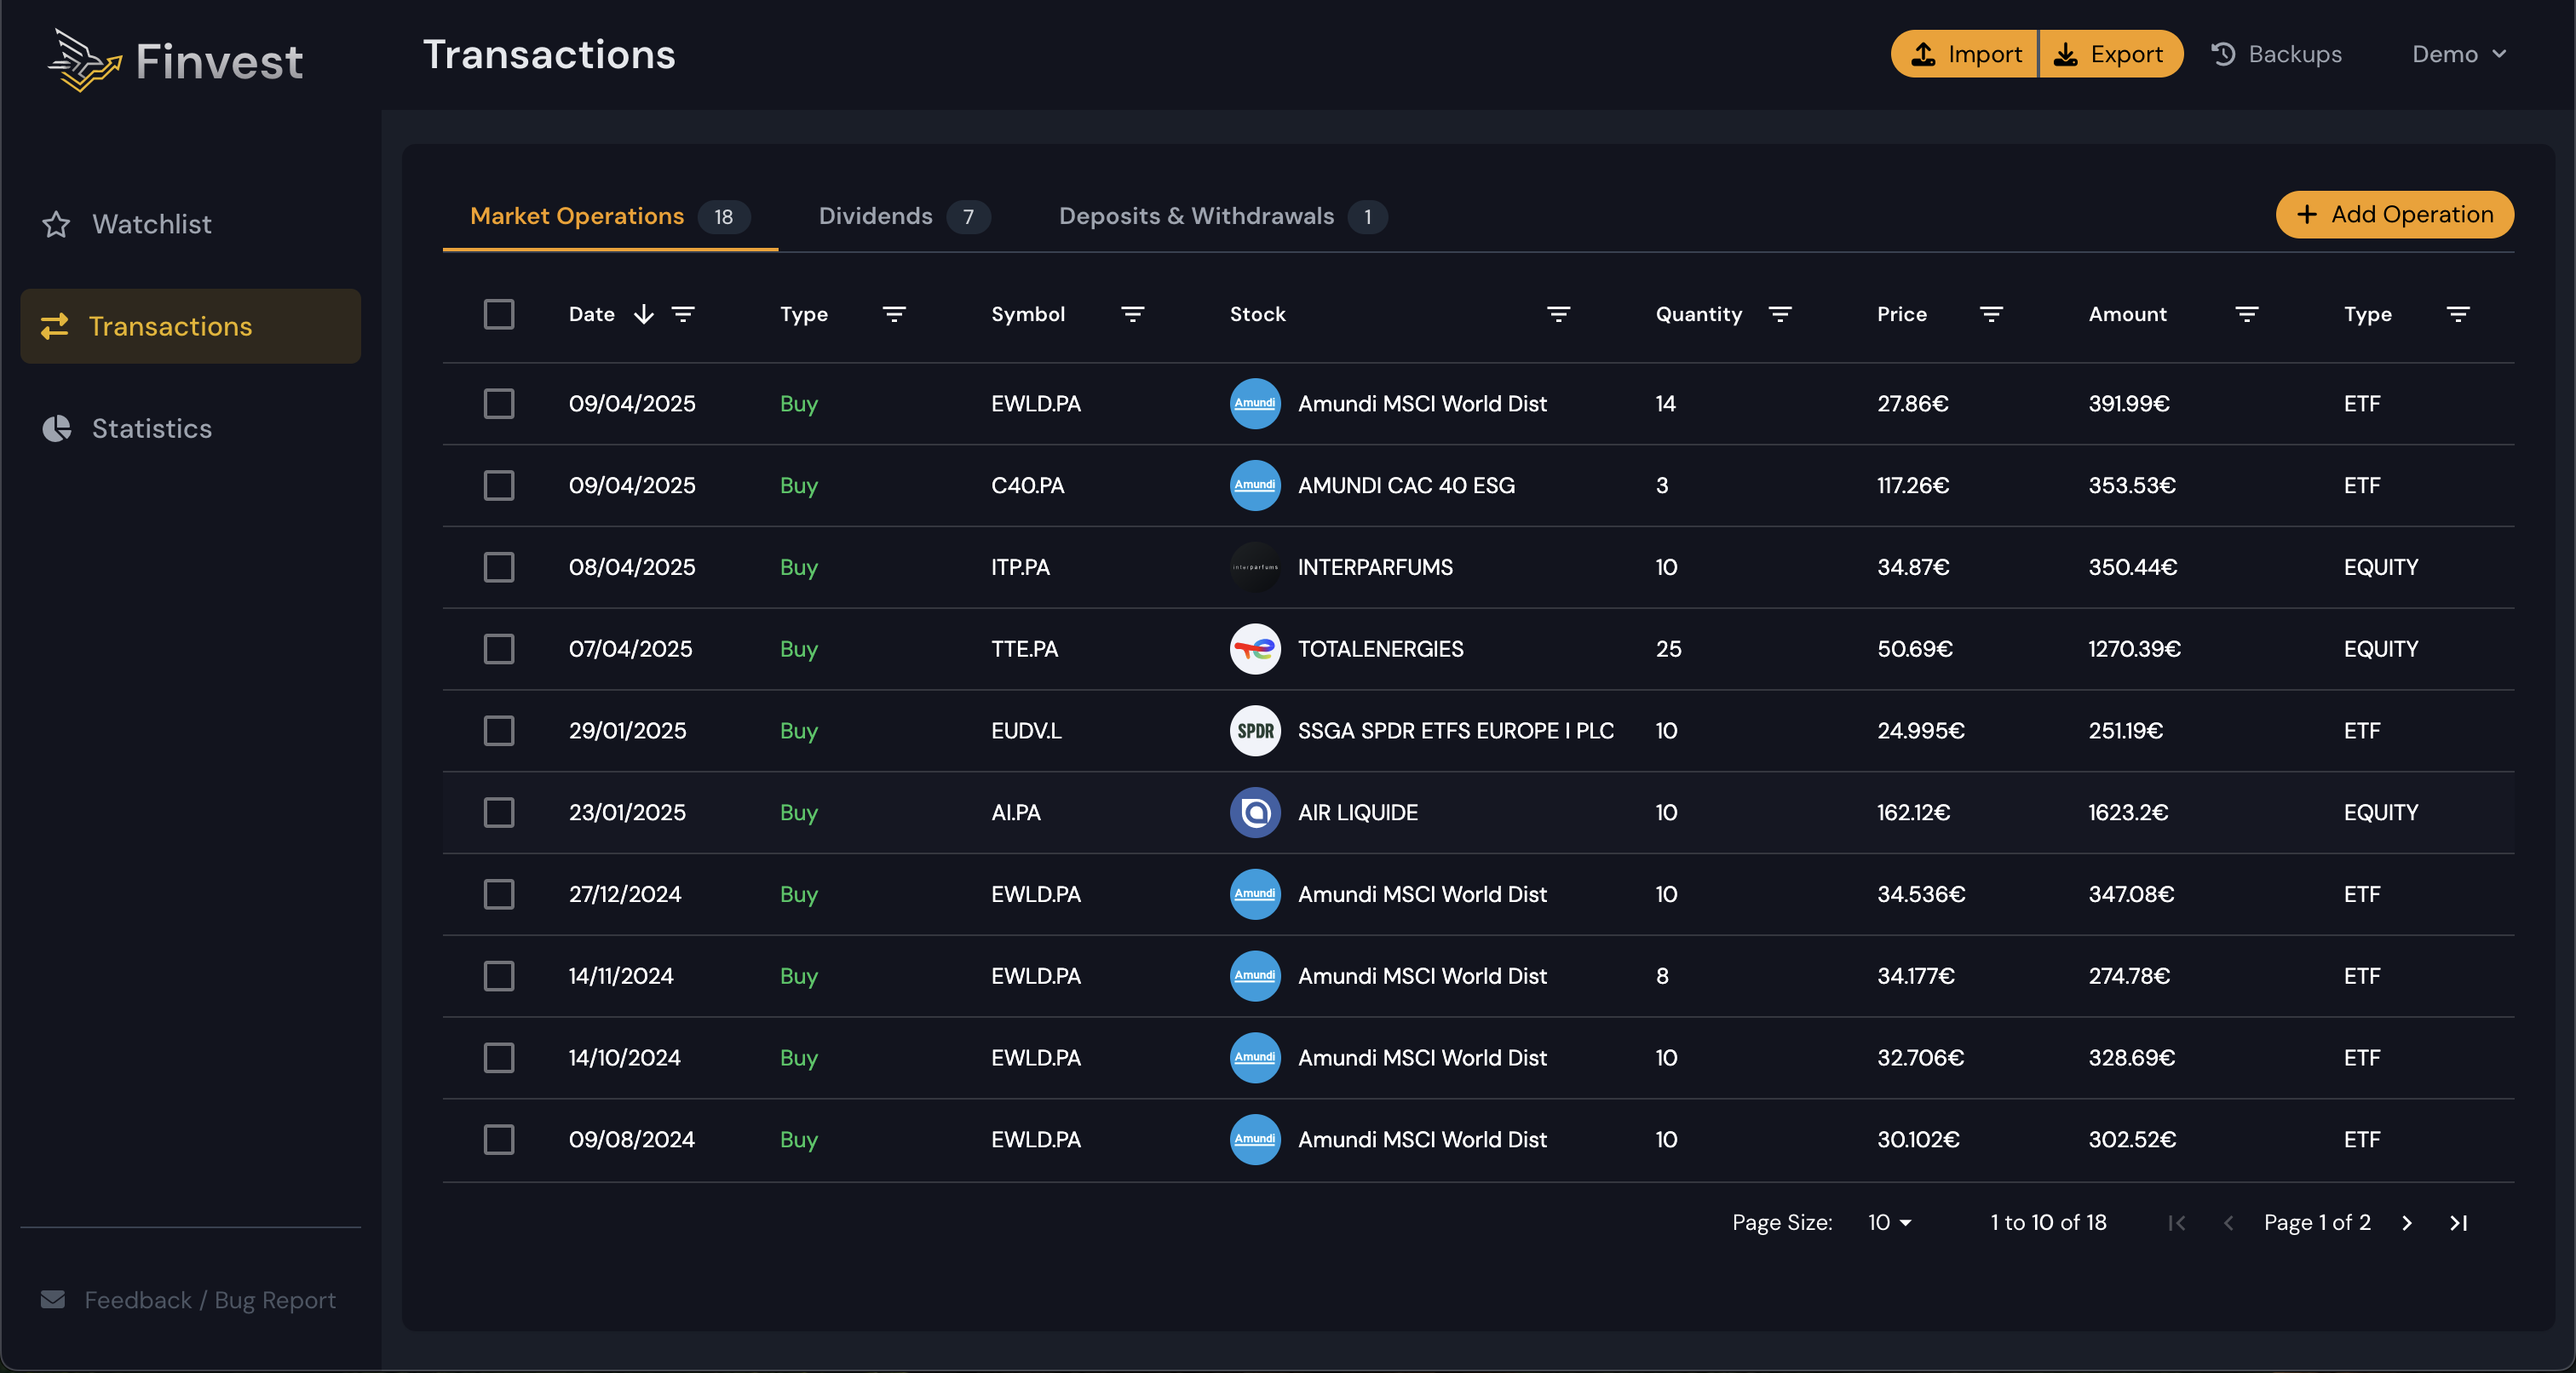
Easily manage all your portfolio transactions.
Add, edit, or delete your trades, dividends, and cash operations in a few clicks. The transactions widget is designed for speed and accuracy, ensuring you never lose track of your investment history.
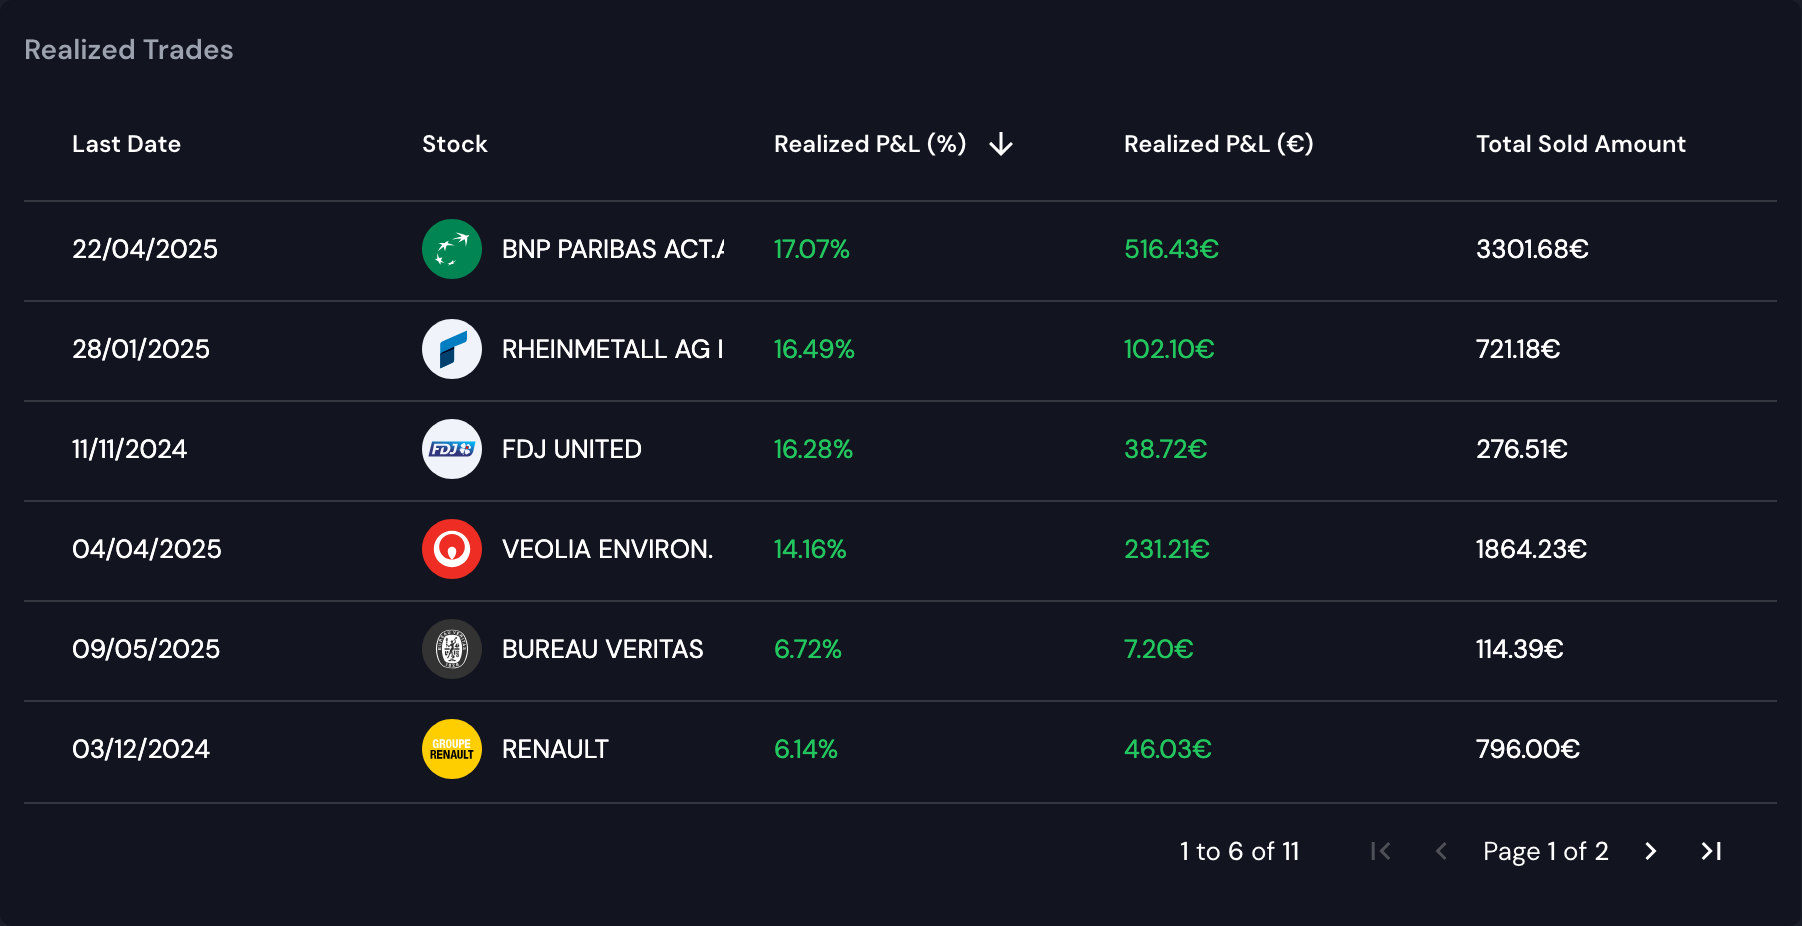
Detailed history of your buys and sells.
Review all your executed trades with full details. This widget helps you analyze your trading habits and optimize your buying and selling strategies.
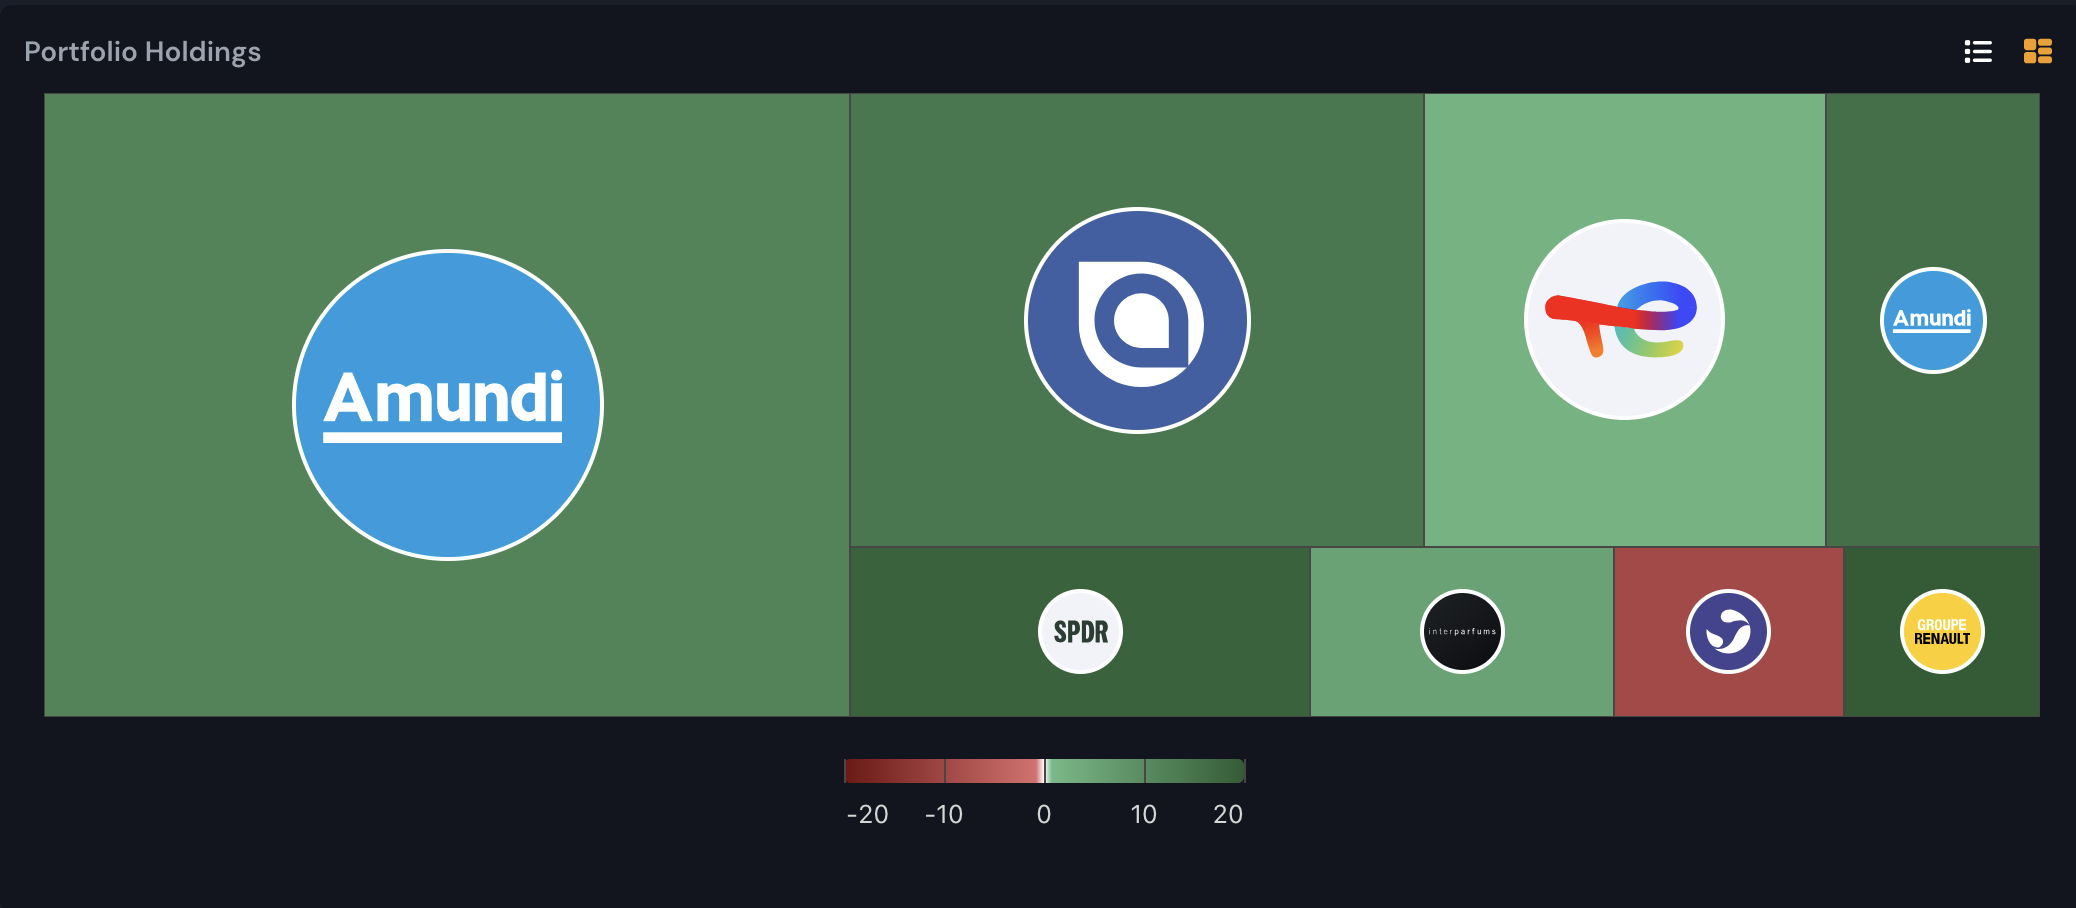
Quickly spot your best and worst performers.
The heatmap widget highlights your top winners and losers, helping you quickly identify what’s working and what needs attention in your portfolio.
Other tools and analytics to go further.
Discover additional features like advanced filters, export options, and custom analytics to get even more value from your investment dashboard.